
Global Soft Rock Mining Equipment Market 2026-2034
February 25, 2026Global Gene Therapy Platform Market 2026-2034
March 12, 2026
Global Data Center Monitoring Market 2026-2034
$2195 – $4195
| Single User | PDF Report, PDF Report + Dashboard (Multi-Users Access), PDF Report + Dashboard (Single User Access) |
|---|
Report Summary
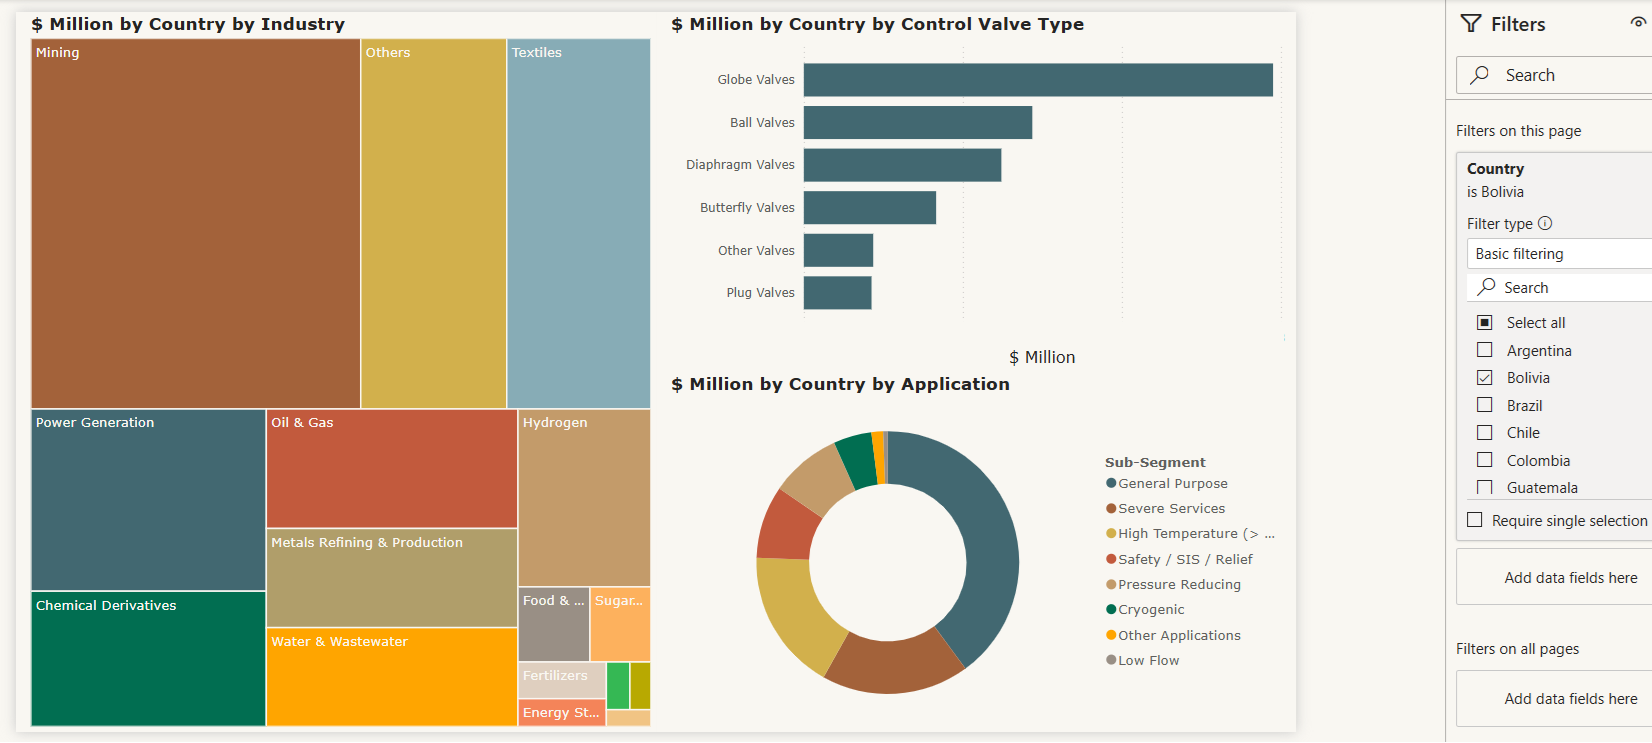
Revolutionize the way you engage with data through our cutting-edge interactive dashboard(Click to enlarge)
- The global data center monitoring market is entering a structural, non-reversible growth phase — from USD 2.3 billion in 2025 to USD 11.4 billion by 2034 at a 19.2% CAGR. The value at stake is not speculative; it is regulatory-mandated. EU Energy Efficiency Directive compliance, the US federal AI infrastructure permitting framework, and the irreversible pivot from transactional hardware to recurring SaaS revenue models are collectively converting monitoring spend from discretionary capex into a non-negotiable operational obligation.
- Implementation Reality exposes a structural paradox: the operators most exposed to regulatory risk are the least equipped to respond. Nearly half of global data centre facilities are over eleven years old, running proprietary BMS protocols incompatible with modern DCIM APIs. Simultaneously, 51% of operators cannot source qualified staff to deploy and operationalise advanced platforms. The result is a dangerous gap — compliance mandates accelerating, while legacy infrastructure and workforce deficits actively suppress adoption velocity.
- Leadership must execute three non-negotiable moves. First, accelerate capital allocation toward managed monitoring services — Schneider’s service bureau and Vertiv’s LIFE Services model effectively monetise the skills gap, converting a market friction into a durable competitive moat. Second, pivot procurement architecture toward vendor-neutral, API-first platforms — proprietary lock-in compounds integration debt and amplifies regulatory exposure across multi-vendor estates. Third, capture the EU compliance cycle now — EED annual reporting obligations and Germany’s waste heat recovery mandates from July 2026 are converting European operators into non-discretionary buyers ahead of schedule.
- The United States commands xx% of the global market and anchors the forecast trajectory, compounding at a 19.6% CAGR. This growth is not demand-driven — it is mandate-driven. Federal Executive Orders classifying AI data centres as “Qualifying Projects,” DOE/FERC interconnection rulemaking with a final rule targeted for April 2026, and Texas’s mandatory demand management regime for loads exceeding 75 MW collectively transform monitoring spend from a capital decision into a compliance obligation. Continental Europe operates on the same logic from a different regulatory architecture: anchored by EU EED reporting mandates and binding carbon-neutrality targets. Both theatres are structurally non-discretionary.
- The implementation gap is structural, not cyclical. Vendor roadmaps assume a capable, ready workforce; field reality does not support this. The Uptime Institute confirms 51% of operators cannot source qualified candidates — a figure unmoved for three consecutive years. Simultaneously, 47% of facilities are over eleven years old, running proprietary BMS protocols architecturally incompatible with modern DCIM APIs. AI operator trust has collapsed from 76% in 2022 to 58% in 2024 — a rational response from an industry burned by prior technology hype cycles. The facilities most exposed to regulatory risk are precisely those least equipped to respond.
Table of Content
1. Report Scope
1.1. Market Segmentation and scope
1.2. Regional Scope
1.3. Estimates and forecast timeline
2. Market Research Methodology
2.1. Research methodology and design
2.2. Sample selection
2.3. Reliability and validity
3. Executive Summary
4. Market Analysis
4.1. Market size and growth rates
4.2. Market growth drivers, market dynamics and trends
4.3. Market scenarios and opportunity forecasts
4.4. Market constraints and challenges
4.5. Industry value chain analysis
4.6. Industry analysis – Porter’s
4.6.1. Threat of new entrants
4.6.2. Bargaining power of suppliers
4.6.3. Bargaining power of buyers
4.6.4. Threat of substitutes
4.6.5. Competitive rivalry
4.7. PEST analysis
4.7.1. Political/legal landscape
4.7.2. Economic landscape
4.7.3. Social landscape
4.7.4. Technological landscape
5. Market Breakdown – by Component
5.1. Introduction
5.2. Solution
5.3. Services
6. Market Breakdown – by Monitoring Type
6.1. Introduction
6.2. Network Monitoring
6.3. Server Monitoring
6.4. Power Monitoring
6.5. Cooling Monitoring
6.6. Environmental Monitoring
6.7. Security Monitoring
7. Market Breakdown – by Data Center Type
7.1. Introduction
7.2. Enterprise Data Centers
7.3. Colocation Data Centers
7.4. Cloud Data Centers
7.5. Managed Data Centers
7.6. Edge Data Centers
8. Market Breakdown – by Deployment
8.1. Introduction
8.2. On-Premises
8.3. Cloud
9. Market Breakdown – by End-use
9.1. Introduction
9.2. IT & Telecom
9.3. BFSI
9.4. Government
9.5. Healthcare
9.6. Retail & E-commerce
9.7. Energy & Utilities
9.8. Manufacturing
9.9. Others
10. Market Breakdown – by Geography
10.1. North America
10.1.1. North America Data Center Monitoring Market, 2026-2034
10.1.2. North America Data Center Monitoring Market, by Component
10.1.3. North America Data Center Monitoring Market, by Monitoring Type
10.1.4. North America Data Center Monitoring Market, by Data Center Type
10.1.5. North America Data Center Monitoring Market, by Deployment
10.1.6. North America Data Center Monitoring Market, by End-Use
10.1.7. North America Data Center Monitoring Market, by Country
10.1.7.1. U.S.
10.1.7.2. Canada
10.1.7.3. Mexico
10.2. South America
10.2.1. South America Data Center Monitoring Market, 2026-2034
10.2.2. South America Data Center Monitoring Market, by Component
10.2.3. South America Data Center Monitoring Market, by Monitoring Type
10.2.4. South America Data Center Monitoring Market, by Data Center Type
10.2.5. South America Data Center Monitoring Market, by Deployment
10.2.6. South America Data Center Monitoring Market, by End-Use
10.2.7. South America Data Center Monitoring Market, by Country
10.2.7.1. Brazil
10.2.7.2. Argentina
10.2.7.3. Others
10.3. Europe
10.3.1. Europe Data Center Monitoring Market, 2026-2034
10.3.2. Europe Data Center Monitoring Market, by Component
10.3.3. Europe Data Center Monitoring Market, by Monitoring Type
10.3.4. Europe Data Center Monitoring Market, by Data Center Type
10.3.5. Europe Data Center Monitoring Market, by Deployment
10.3.6. Europe Data Center Monitoring Market, by End-Use
10.3.7. Europe Data Center Monitoring Market, by Country
10.3.7.1. Germany
10.3.7.2. France
10.3.7.3. U.K.
10.3.7.4. Italy
10.3.7.5. Spain
10.3.7.6. Sweden
10.3.7.7. Belgium
10.3.7.8. Denmark
10.3.7.9. Ireland
10.3.7.10. Switzerland
10.3.7.11. Netherlands
10.3.7.12. Norway
10.3.7.13. Poland
10.3.7.14. Russia
10.3.7.15. Others
10.4. Asia-Pacific
10.4.1. APAC Data Center Monitoring Market, 2026-2034
10.4.2. APAC Data Center Monitoring Market, by Component
10.4.3. APAC Data Center Monitoring Market, by Monitoring Type
10.4.4. APAC Data Center Monitoring Market, by Data Center Type
10.4.5. APAC Data Center Monitoring Market, by Deployment
10.4.6. APAC Data Center Monitoring Market, by End-Use
10.4.7. APAC Data Center Monitoring Market, by Country
10.4.7.1. China
10.4.7.2. Japan
10.4.7.3. South Korea
10.4.7.4. Singapore
10.4.7.5. India
10.4.7.6. Australia
10.4.7.7. Others
10.5. Middle East & Africa
10.5.1. MEA Data Center Monitoring Market, 2026-2034
10.5.2. MEA Data Center Monitoring Market, by Component
10.5.3. MEA Data Center Monitoring Market, by Monitoring Type
10.5.4. MEA Data Center Monitoring Market, by Data Center Type
10.5.5. MEA Data Center Monitoring Market, by Deployment
10.5.6. MEA Data Center Monitoring Market, by End-Use
10.5.7. MEA Data Center Monitoring Market, by Country
10.5.7.1. UAE
10.5.7.2. Saudi Arabia
10.5.7.3. Israel
10.5.7.4. South Africa
10.5.7.5. Others
11. Competitive Landscape
11.1. Global Revenue Share Analysis (%), by Leading Players
11.2. North America Revenue Share Analysis (%), by Leading Players
11.3. Europe Revenue Share Analysis (%), by Leading Players
11.4. APAC Revenue Share Analysis (%), by Leading Players
11.5. South America Revenue Share Analysis (%), by Leading Players
11.6. MEA Revenue Share Analysis (%), by Leading Players
11.7. Key Companies List
11.7.1. 42U.com
11.7.2. ABB Ltd.
11.7.3. Carrier
11.7.4. Cisco Systems, Inc.
11.7.5. Datadog
11.7.6. Delta Electronics
11.7.7. Eaton Corporation plc
11.7.8. Emerson Electric Co.
11.7.9. Hewlett Packard Enterprise (HPE)
11.7.10. IBM Corporation
11.7.11. Johnson Controls International plc
11.7.12. Nagios Enterprises
11.7.13. New Relic
11.7.14. Panduit Corp
11.7.15. Rittal GmbH & Co. KG
11.7.16. Schneider Electric
11.7.17. Securitas Technology
11.7.18. Siemens AG
11.7.19. SolarWinds Worldwide, LLC.
11.7.20. Sunbird Software
11.7.21. Vertiv Group Corp.
